# Lenses Alerts
Lenses monitor your topics and provide visuals to help you ensure health status on data production/consumption and distribution.
### Data produced
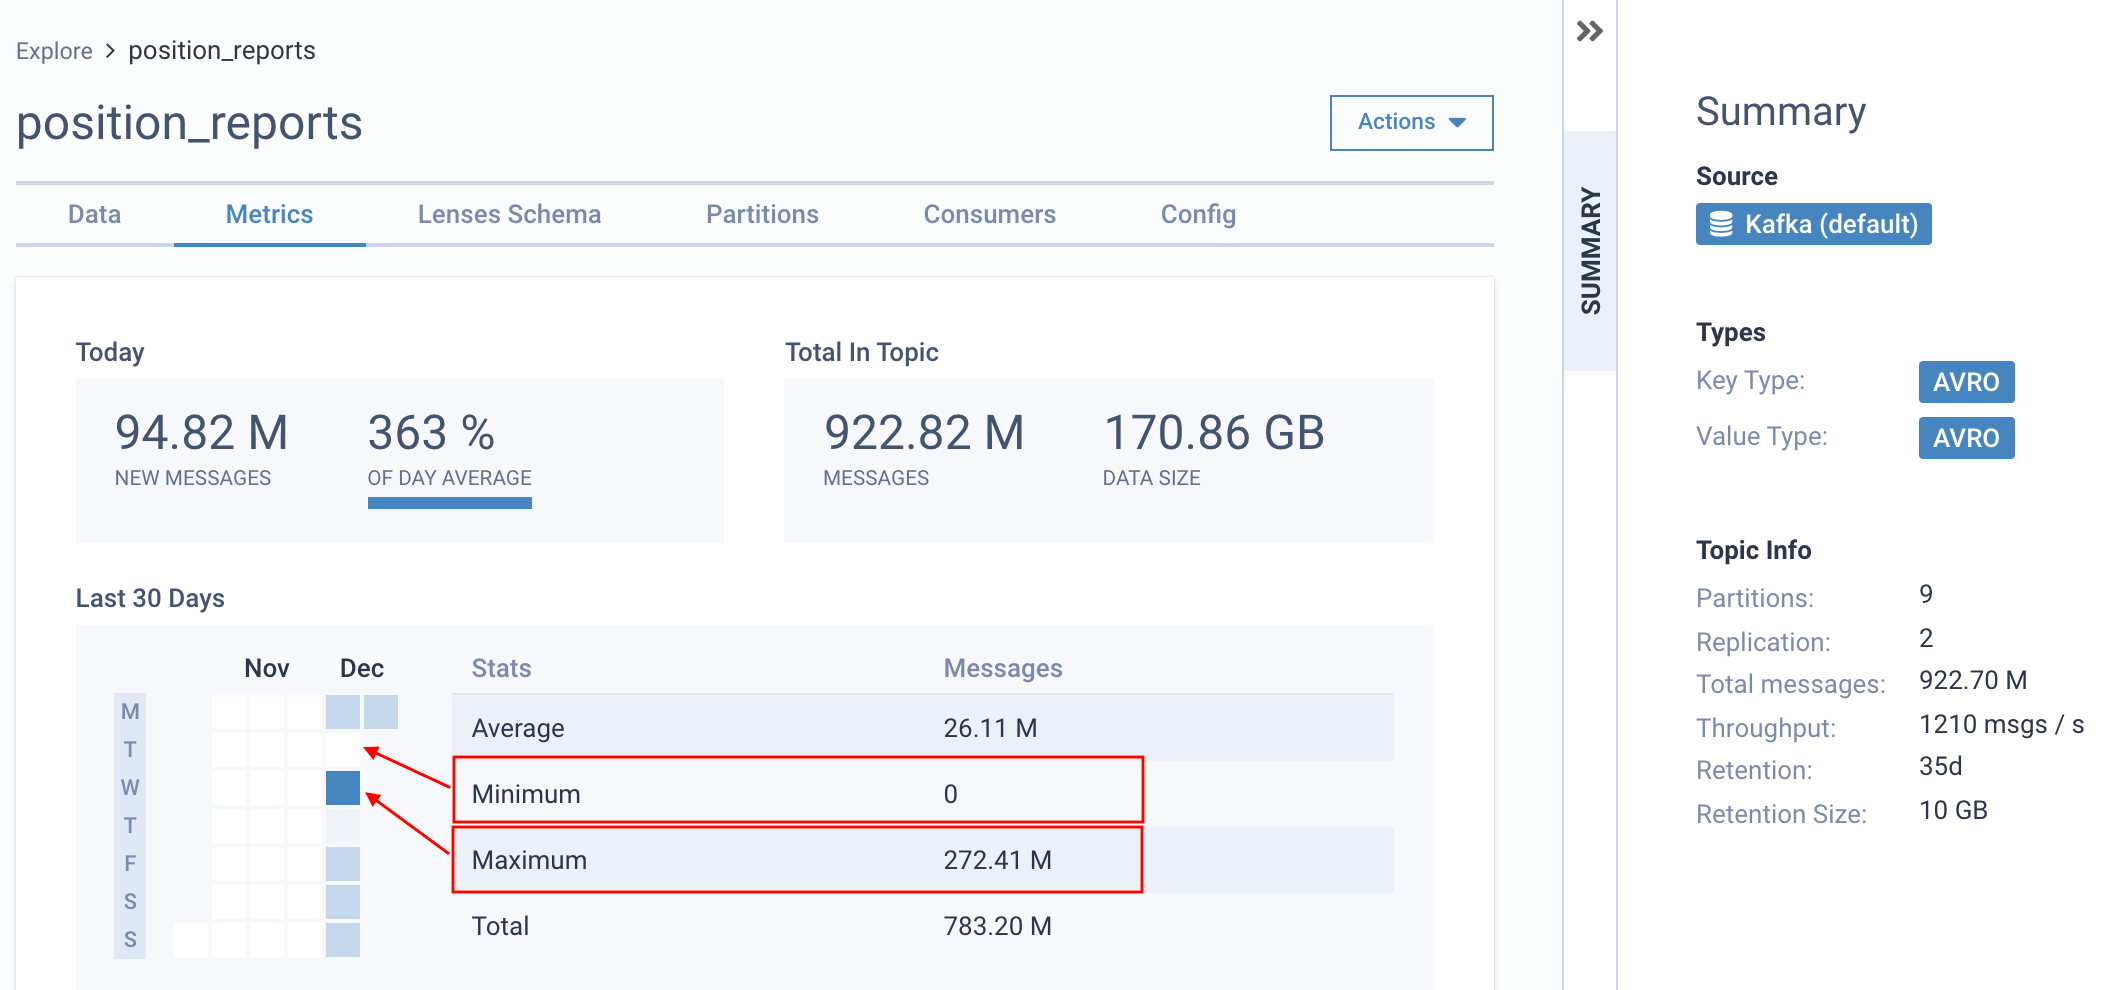
Lenses continuously monitor all Kafka events produced in a Kafka cluster. It uses the native Kafka client to calculate real-time metrics around events produced in a Kafka topic per time window.
The above highlights the messages produced on the Kafka topic over the last 30 days. The minimum, average and maximum number of daily events are visualized to enable you to identify your producers' real behavior easily.
The metrics are stored in Lenses for 30 days.
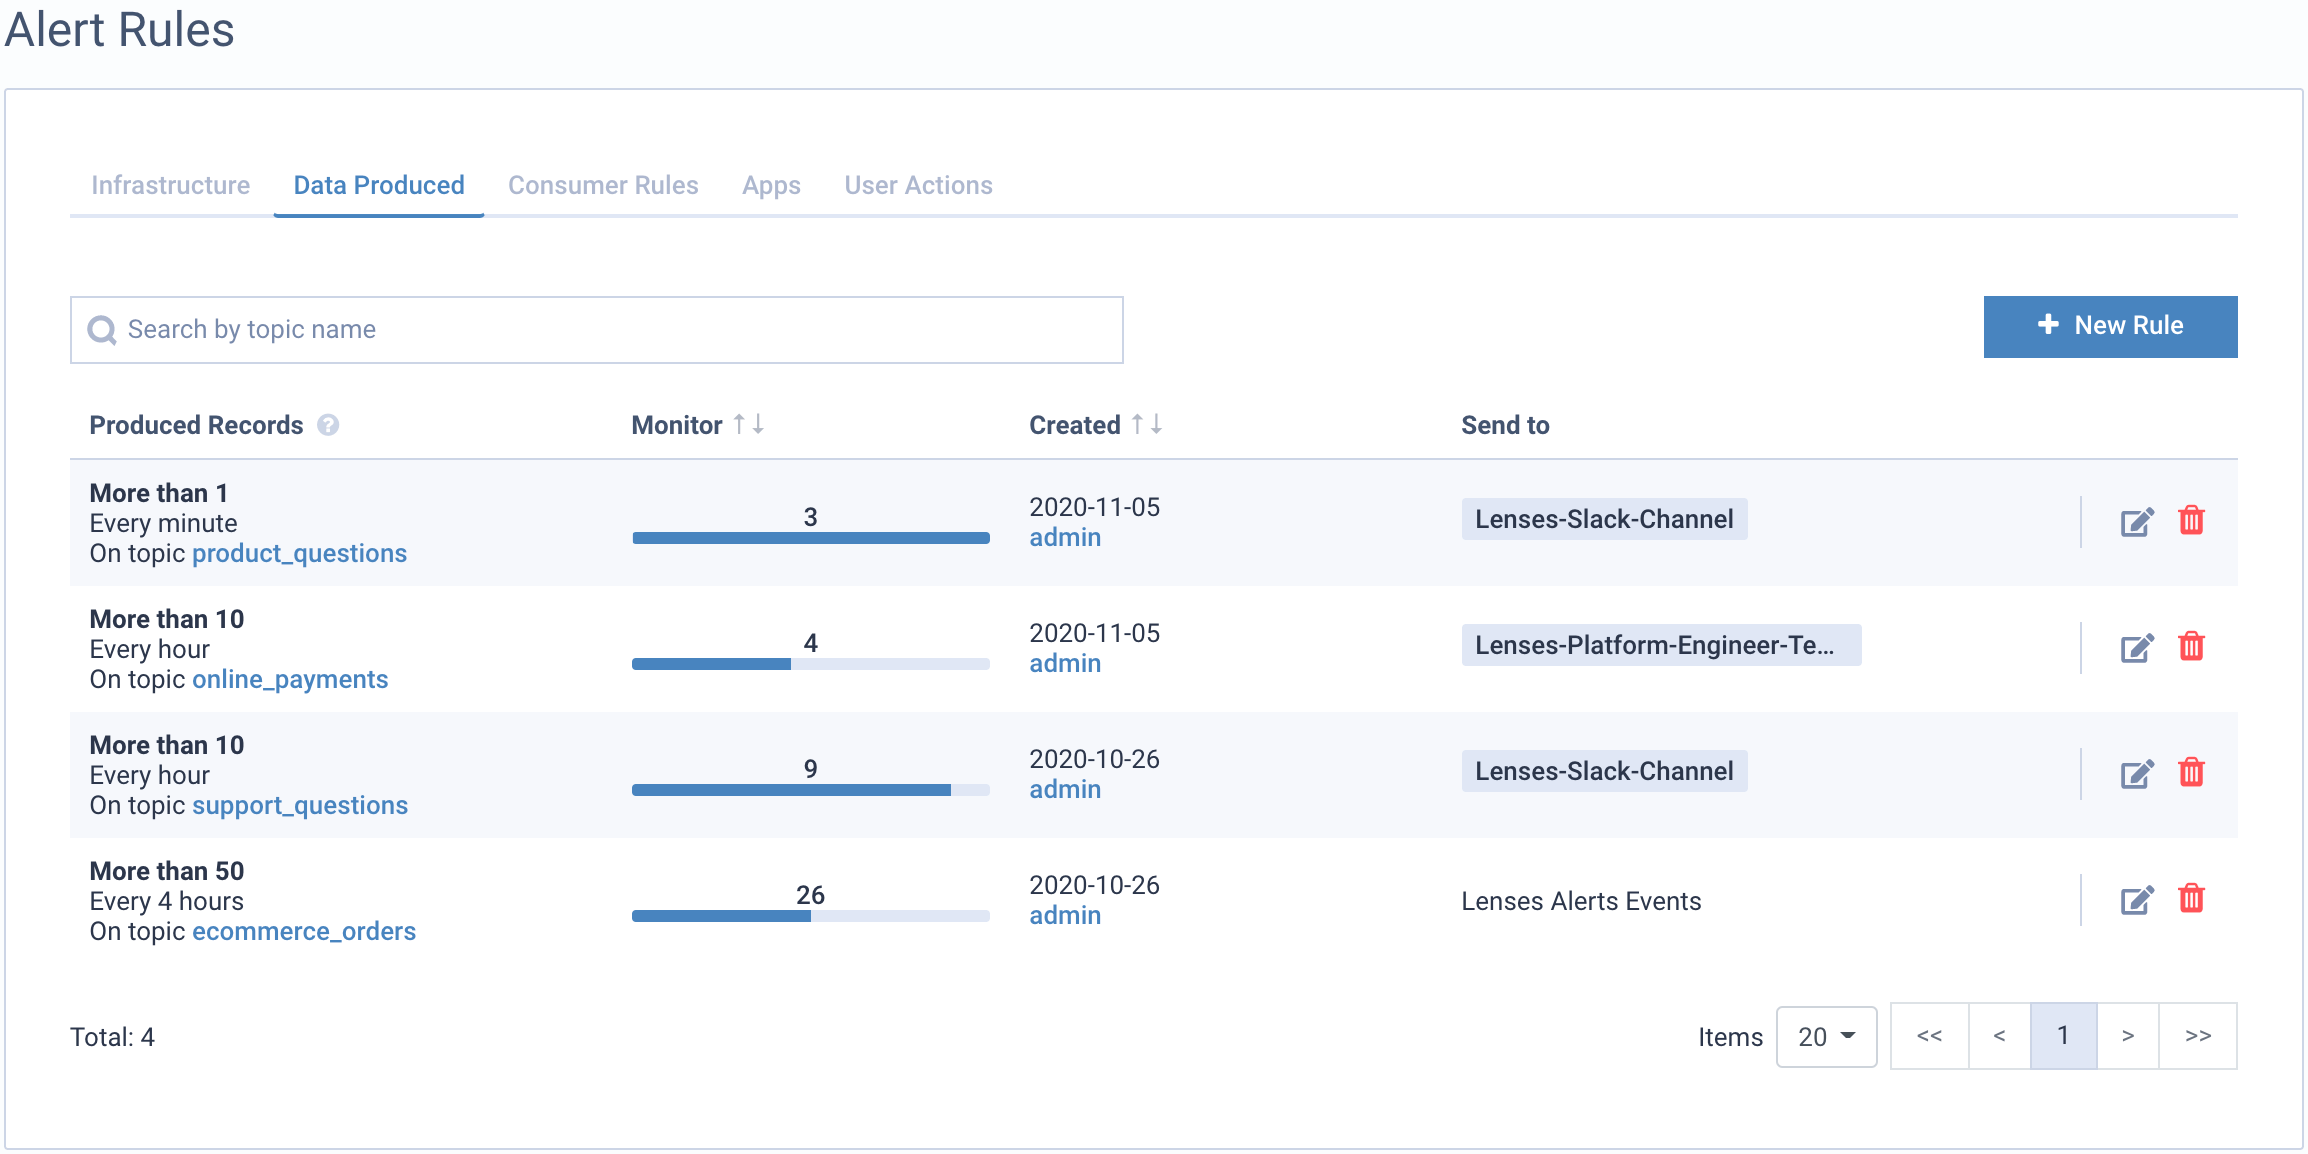
You can add **Alerts** on data produced metrics to ensure your SLAs.
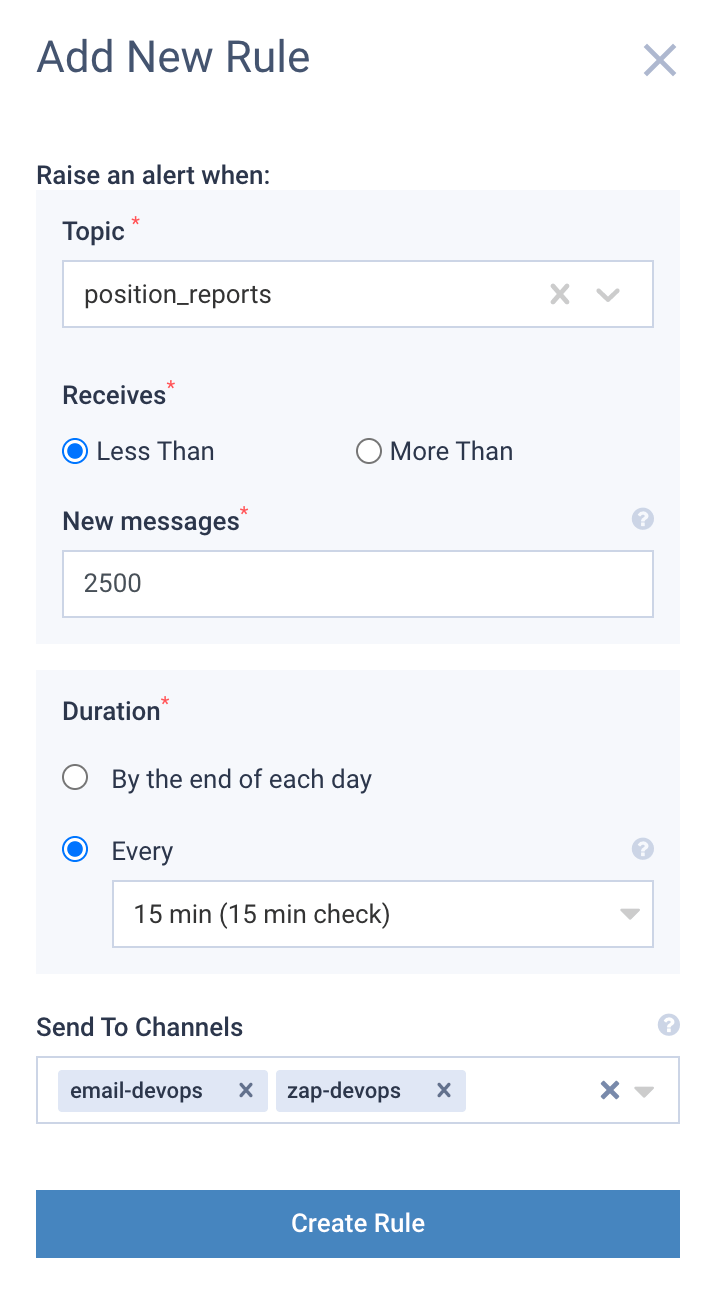
Adding a new Data SLA requires setting up a threshold, a time window, and who (which channel) to notify when the alert is triggered.
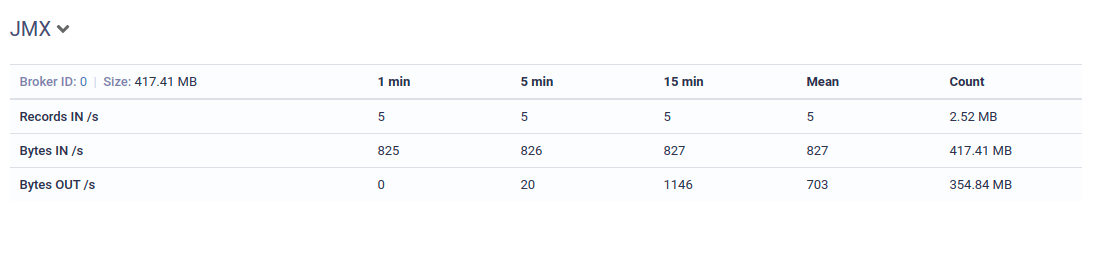
**JMX** On the bottom of the metrics page, a data table is available. This summarizes key topic metrics across your cluster sourced by JMX if enabled.
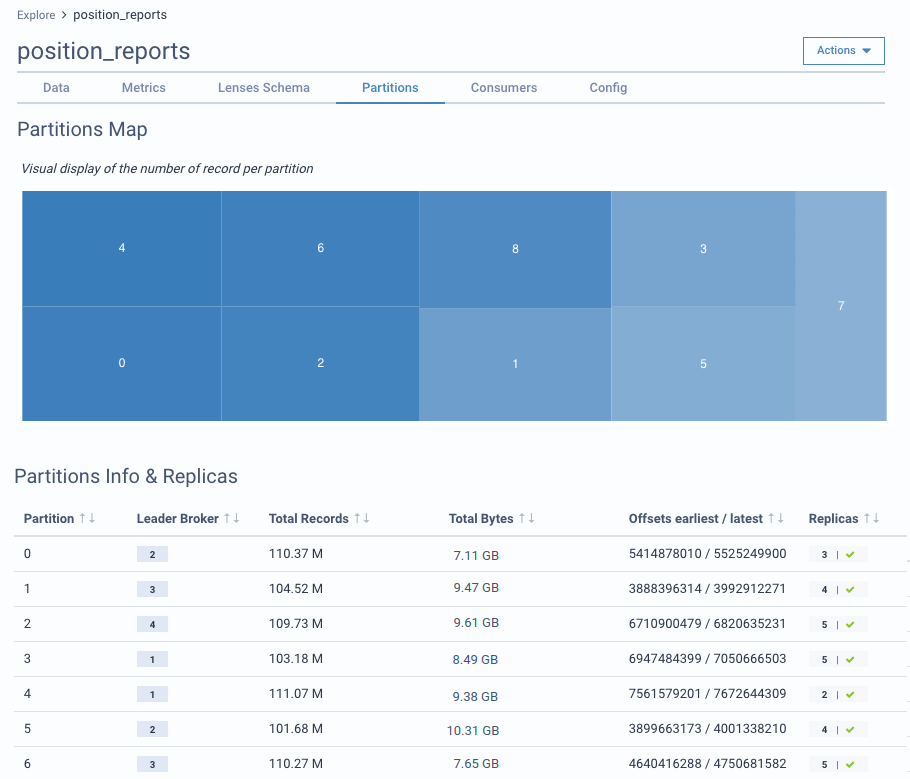
### Partitions and replicas
Lenses add observability and health monitoring of Kafka partitions. The visual map displays the number of messages currently stored per topic partition. Using this map, you can quickly identify if a partition has been over-utilized and requires rearranging the partitioning strategy.
The technical information on the partitions is also available, including the replication status. Partition information includes:
* Leader broker per partition
* Records per partition
* Data size per partition
* Max and min offset per partition
* Whether replicas are in-sync
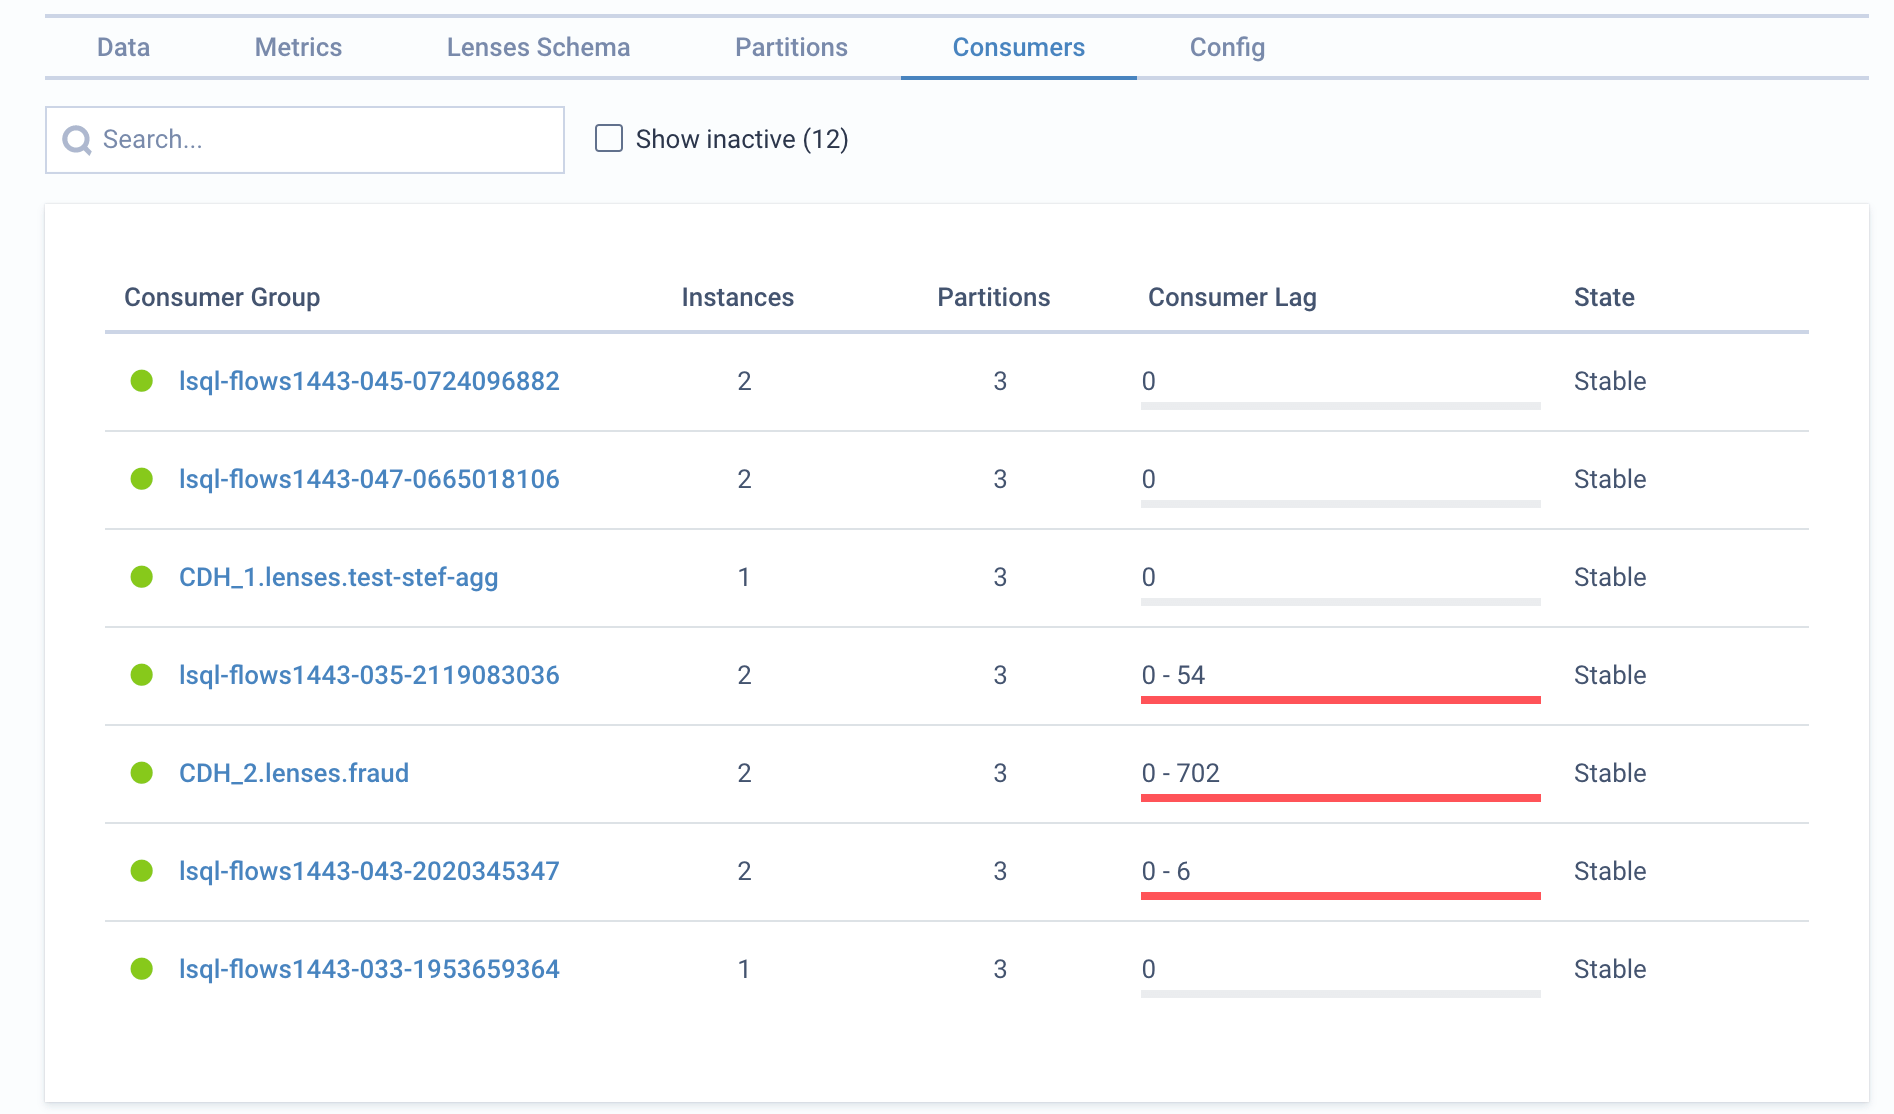
### Monitor topic consumers
For each topic, you can view its consumers. The lag is visualized in a bar by showing each partition's minimum and maximum consumer lag. Drill down to the consumer details to see each partition.
\
For each consumer group, you can add Alerts for the lag threshold. If you want to monitor all your cluster consumers navigate to Consumers.