# Splunk
Set up **Splunk** to receive audit logs from Lenses.
### Set up
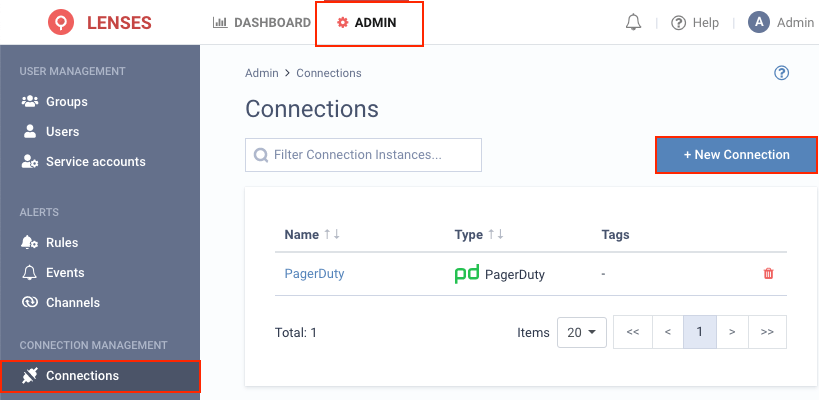
**1.** Visit **Admin → Connections** and click **New connection**
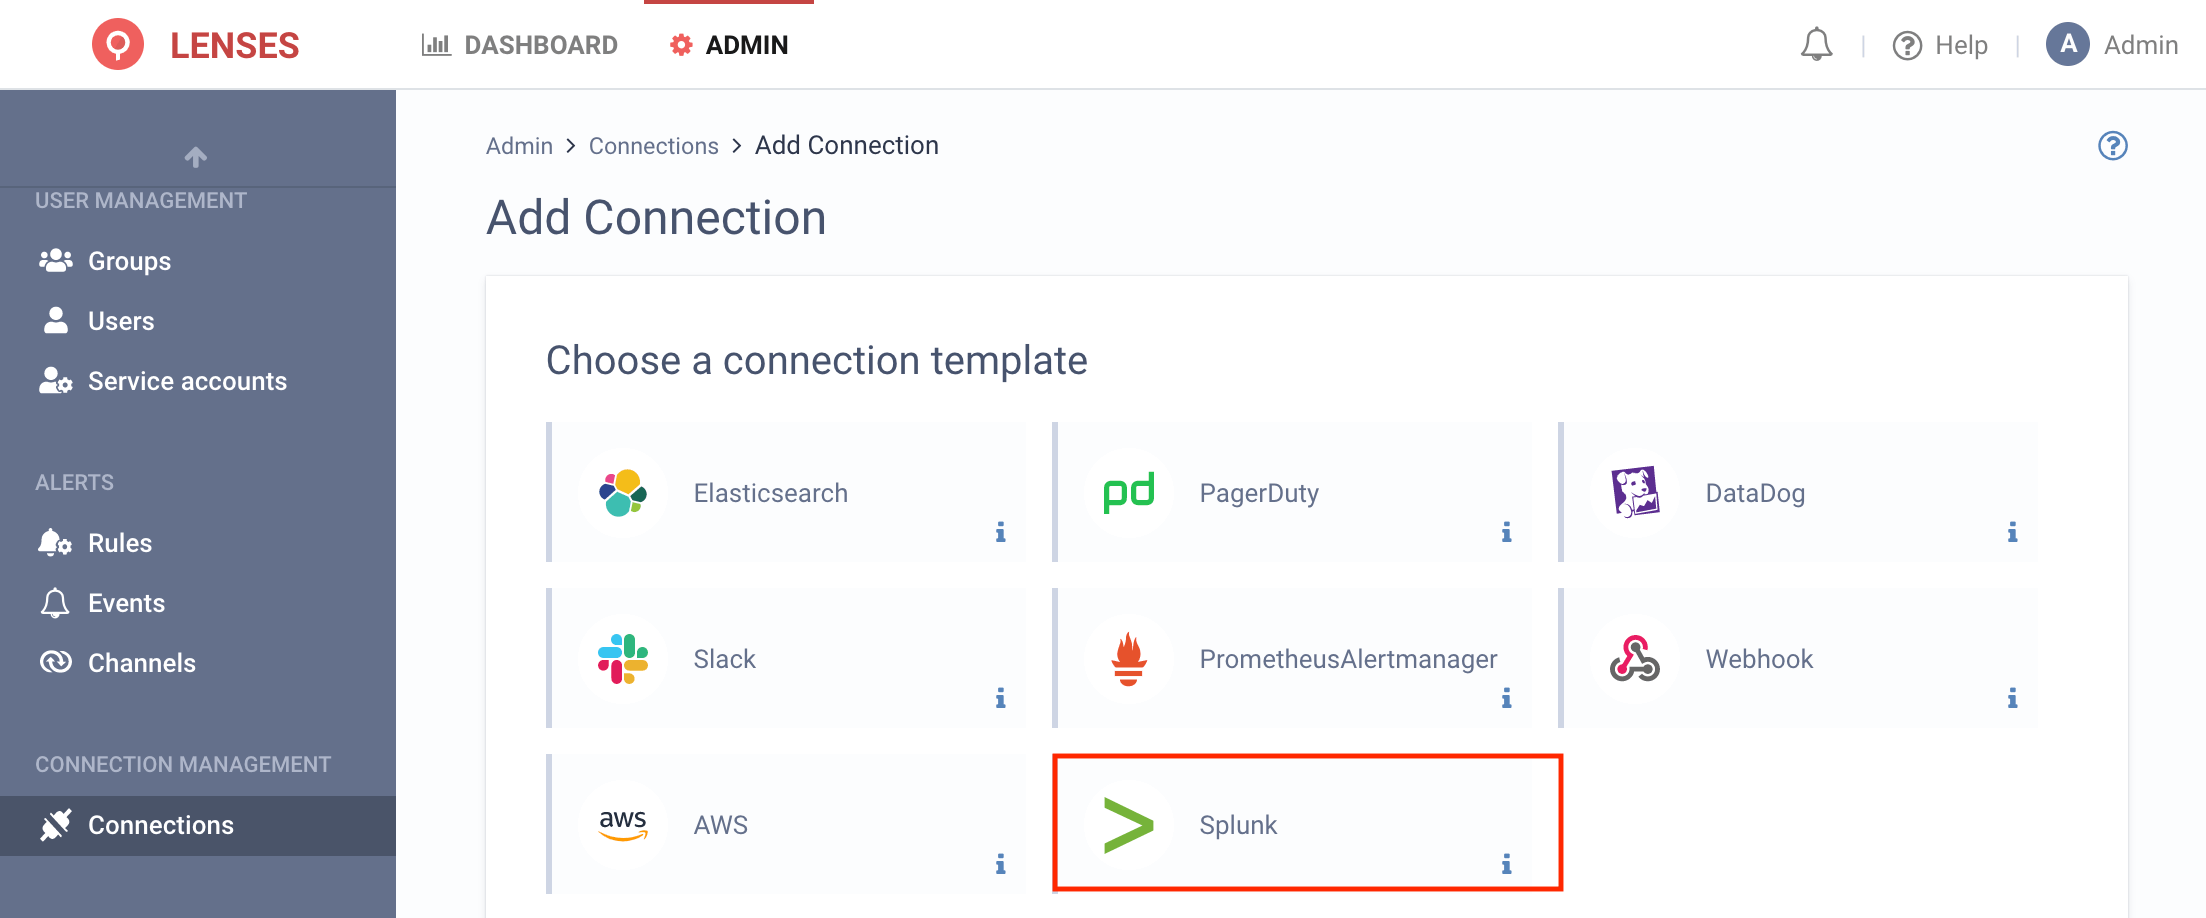
**2.** Select **Splunk**
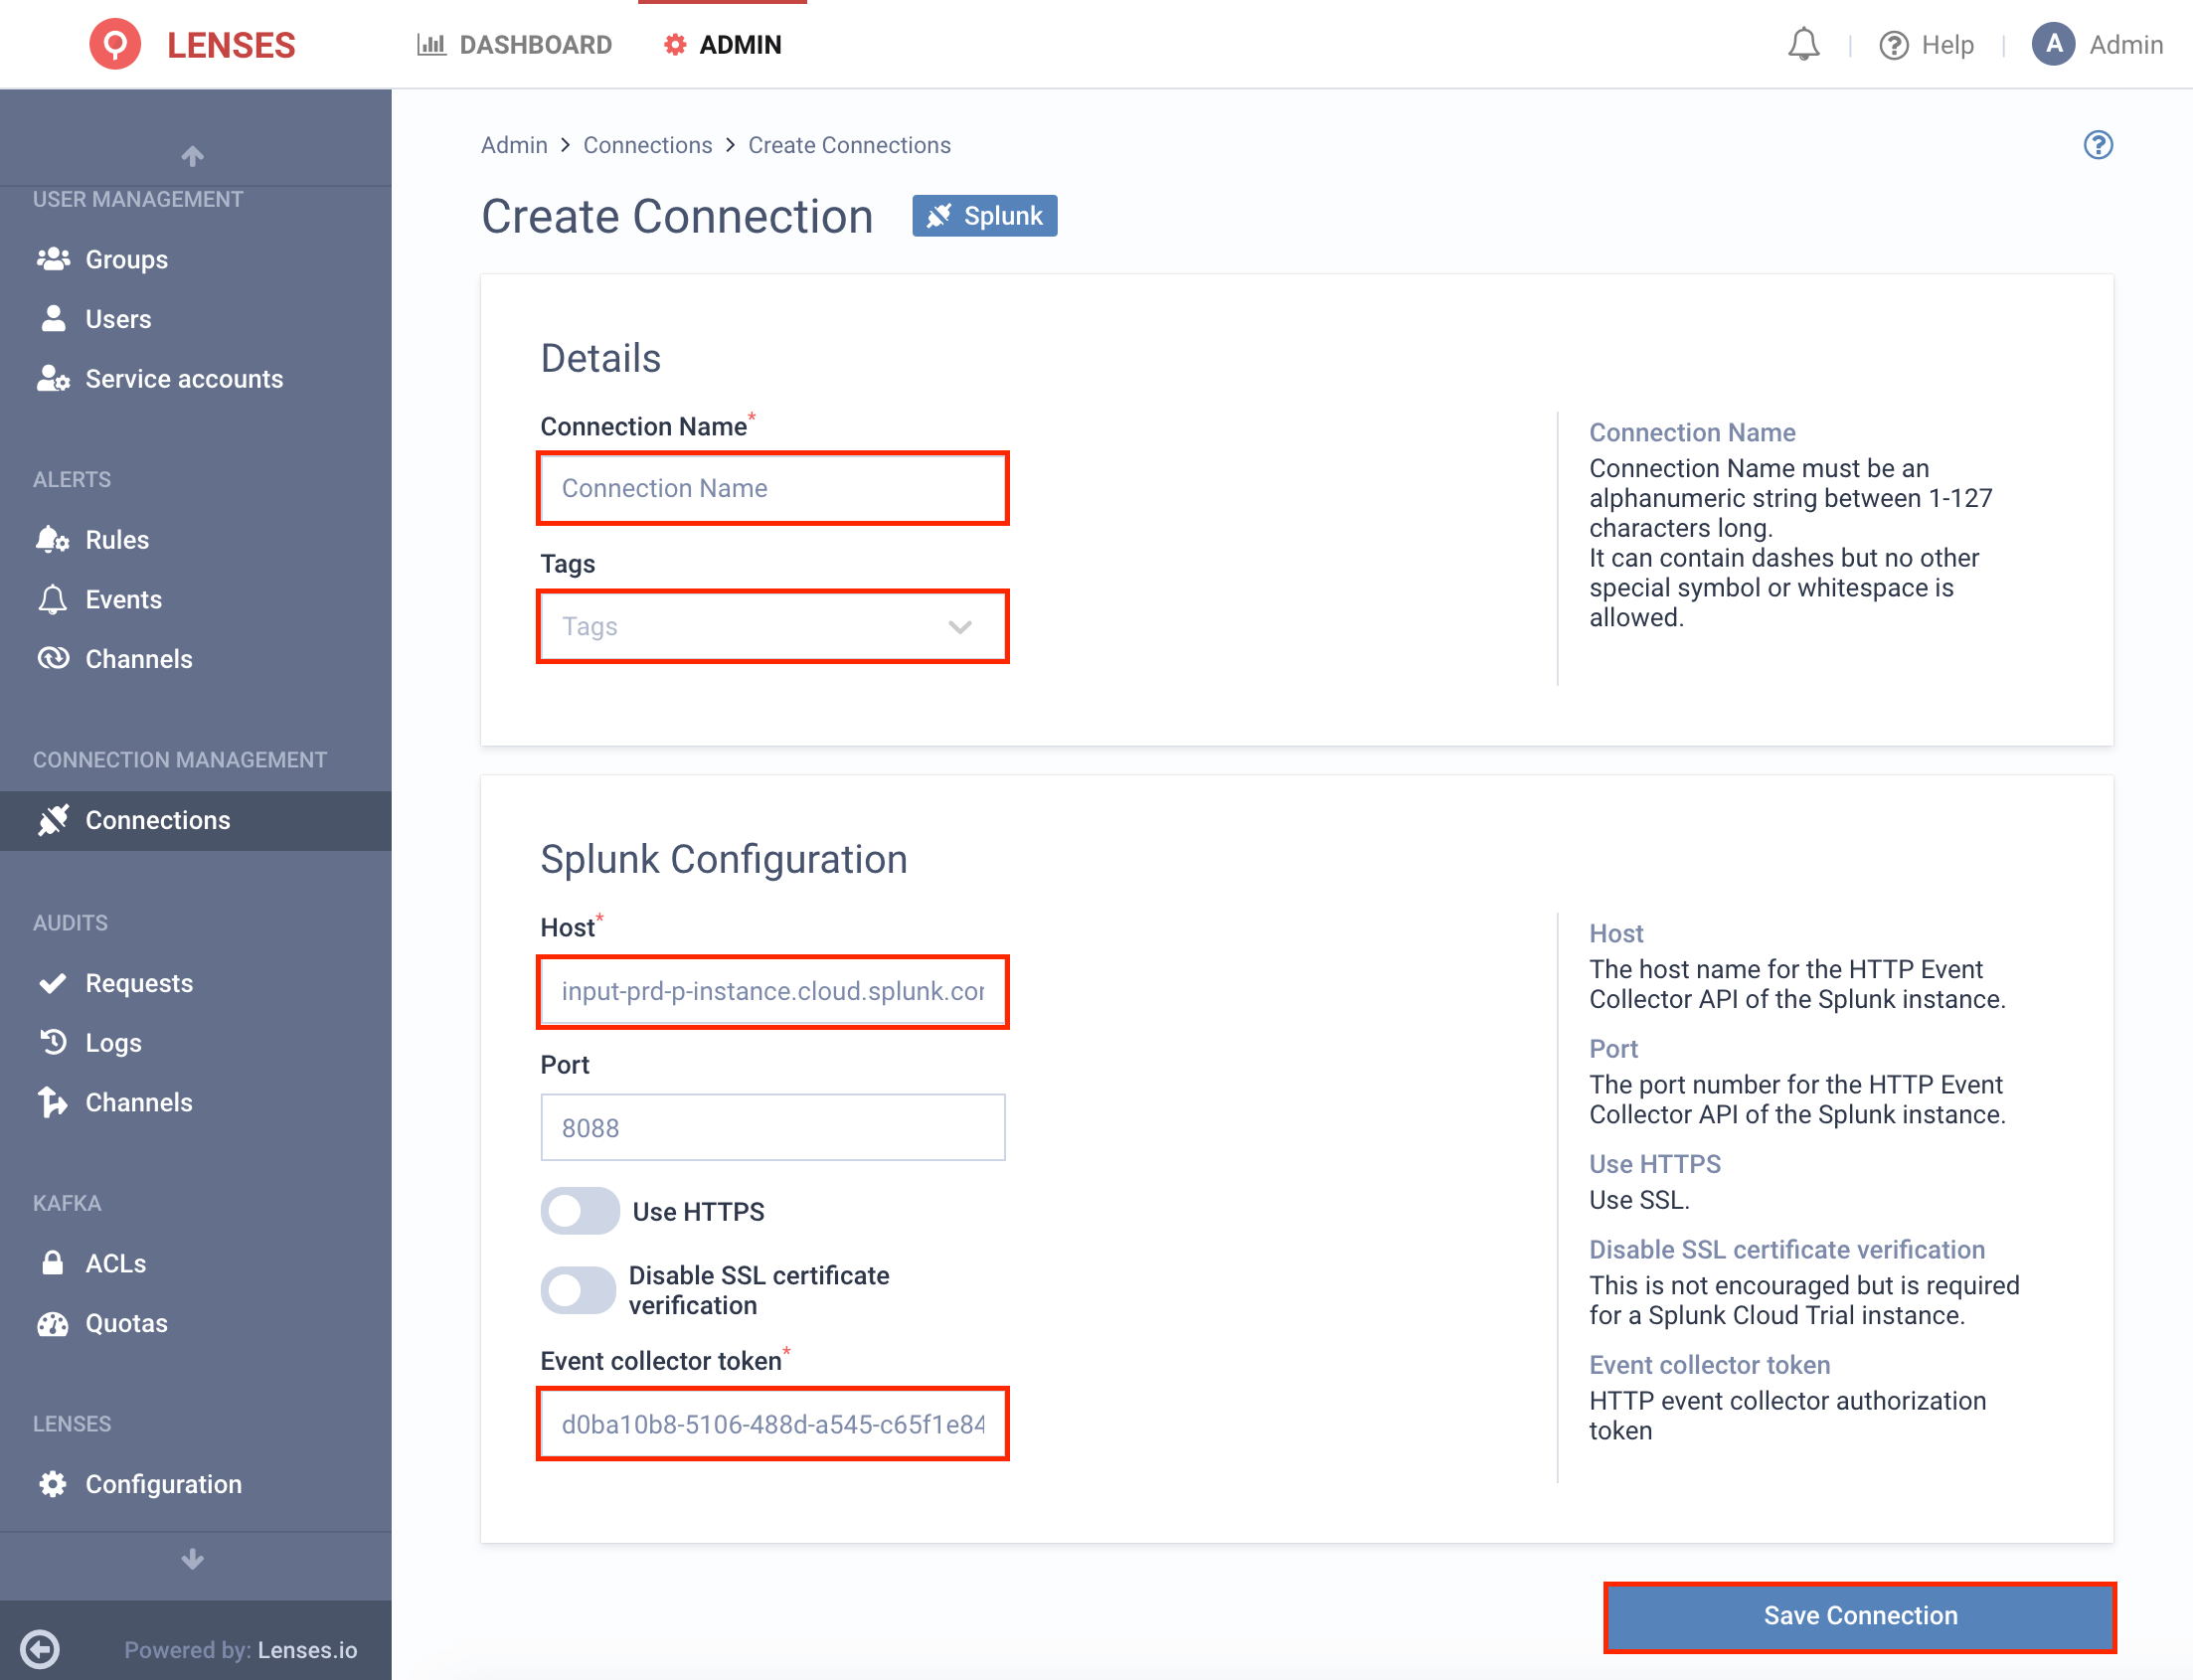
**3.** Provide a name and configuration
Lenses integrate with Splunk’s HTTP Event Collector API.
You must provide the host and port of the HTTP Event Collector endpoint of your Splunk installation. Additionally, you need to create an HTTP Event Collector Token within Splunk - this token must not have “Enable indexer acknowledgment” turned on.
### Add channel
Next add one or multiple target Splunk channels.
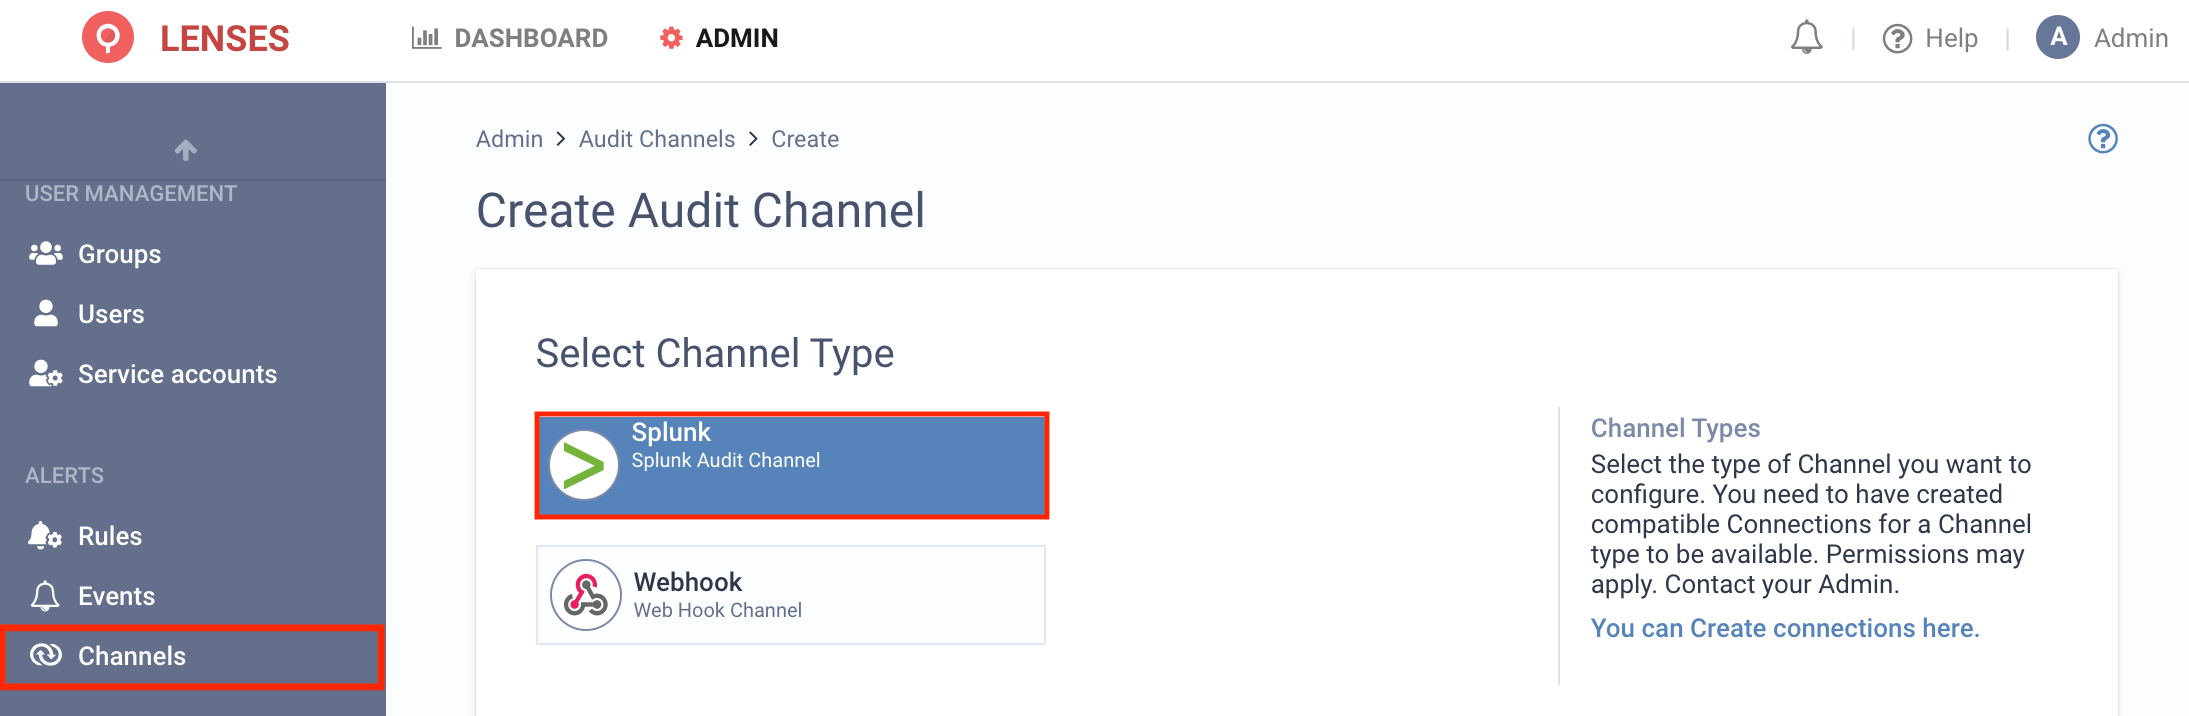
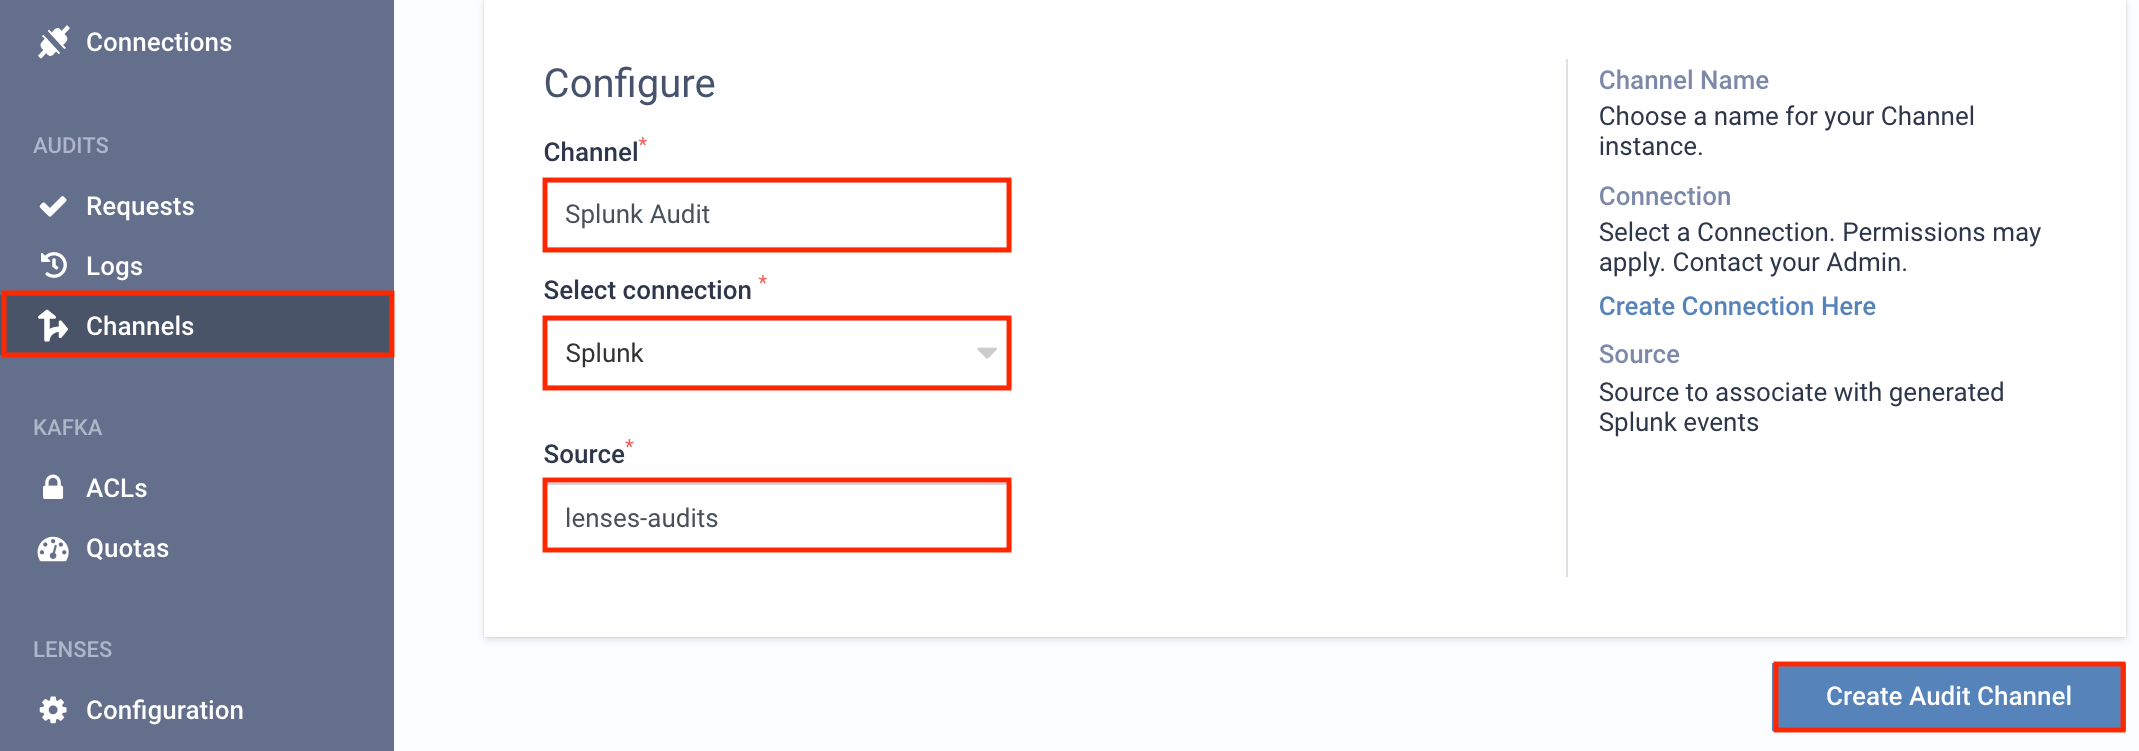
**1.** Visit **Admin → (Audits) Channels** and click **Splunk**
**2.** Setup the configuration options
For example, the above will create the `Splunk Audit` channel that will use the **Splunk** connection to create events in Splunk for all Lenses audits, with a Splunk event source value of `lenses-audits`.
### An example
If, for example, you create a rule to send audits to Splunk, an HTTP API call will be made to the Splunk endpoint when a new audit entry is added.
### Splunk Webhook
Set up alerts from Lenses.io to **Splunk** via a Webhook to send to a Splunk HTTP Event Collector (HEC) connection.
#### Set up
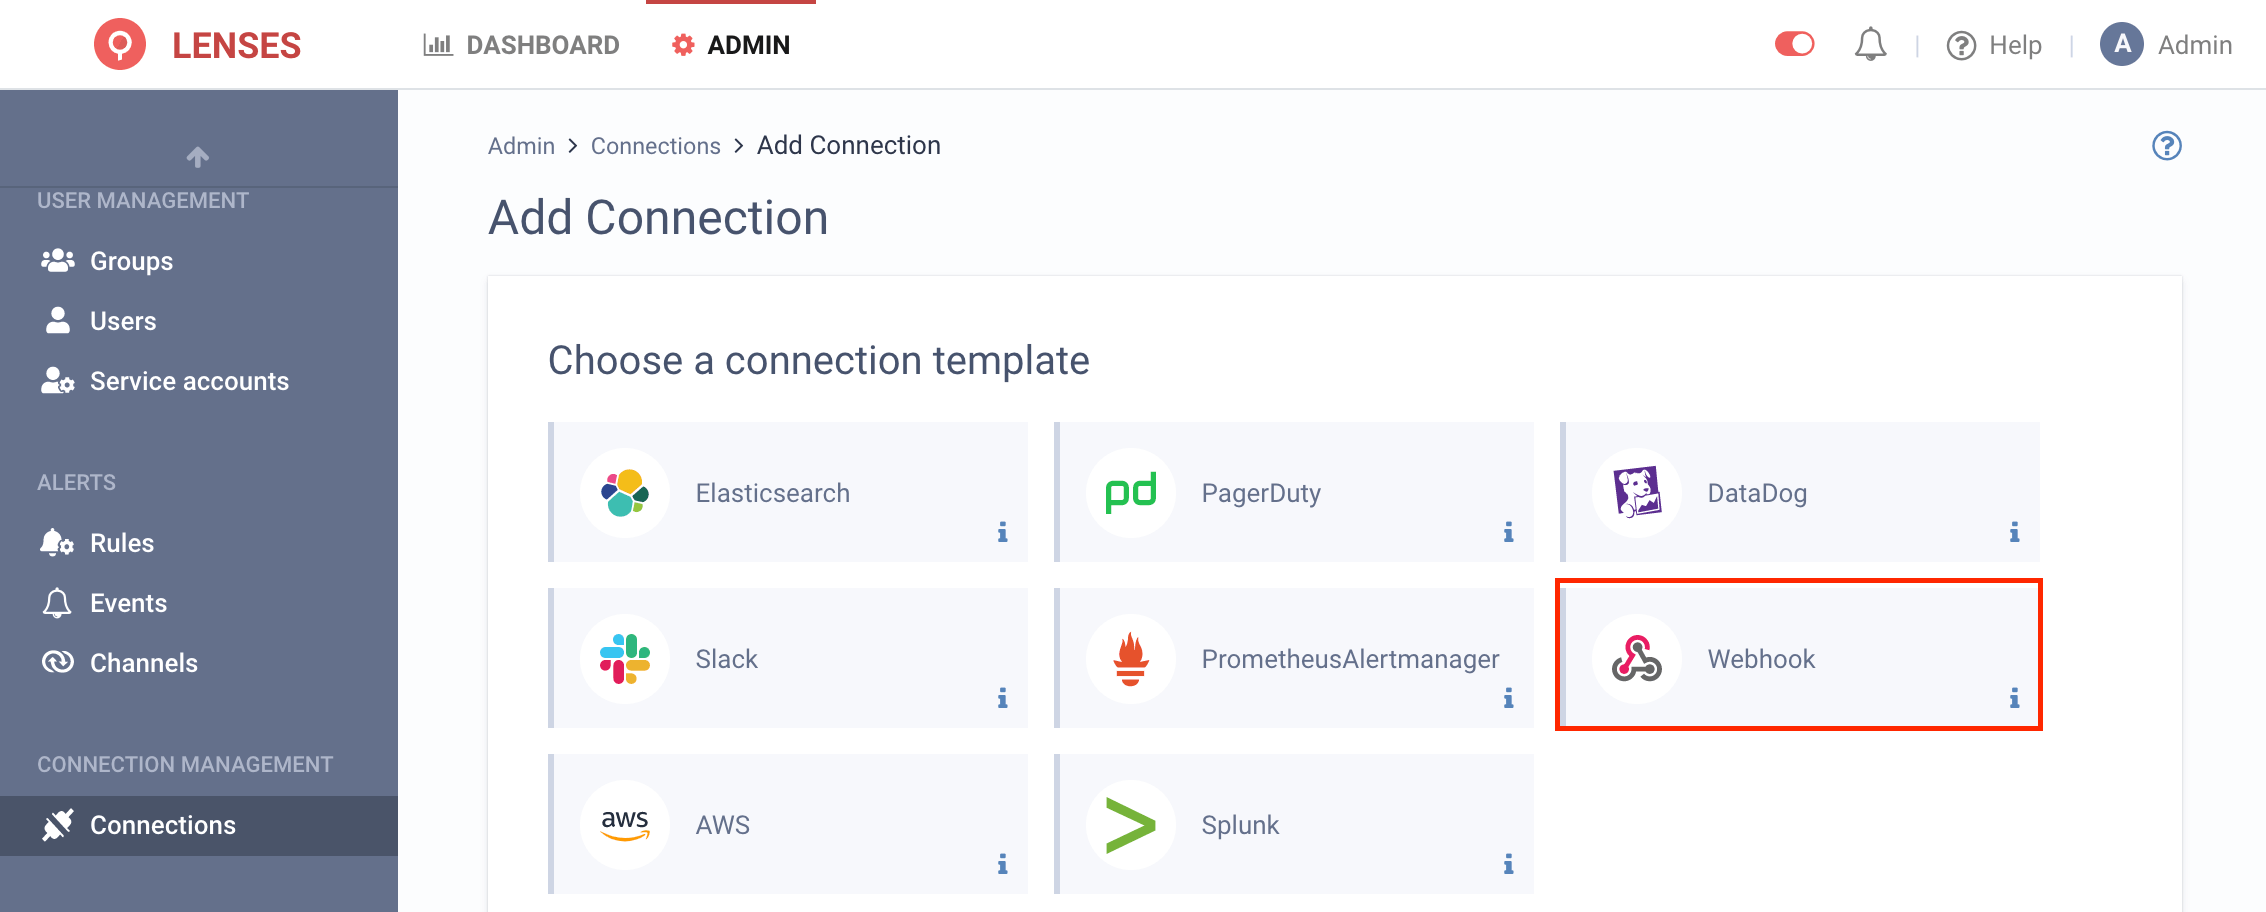
**1.** Visit **Admin → Connections** and click **New connection**
**2.** Select **Webhook** (Note: Use webhook for alerts and SIEM - audit events the native Splunk connection)
**3.** Provide a name and configuration
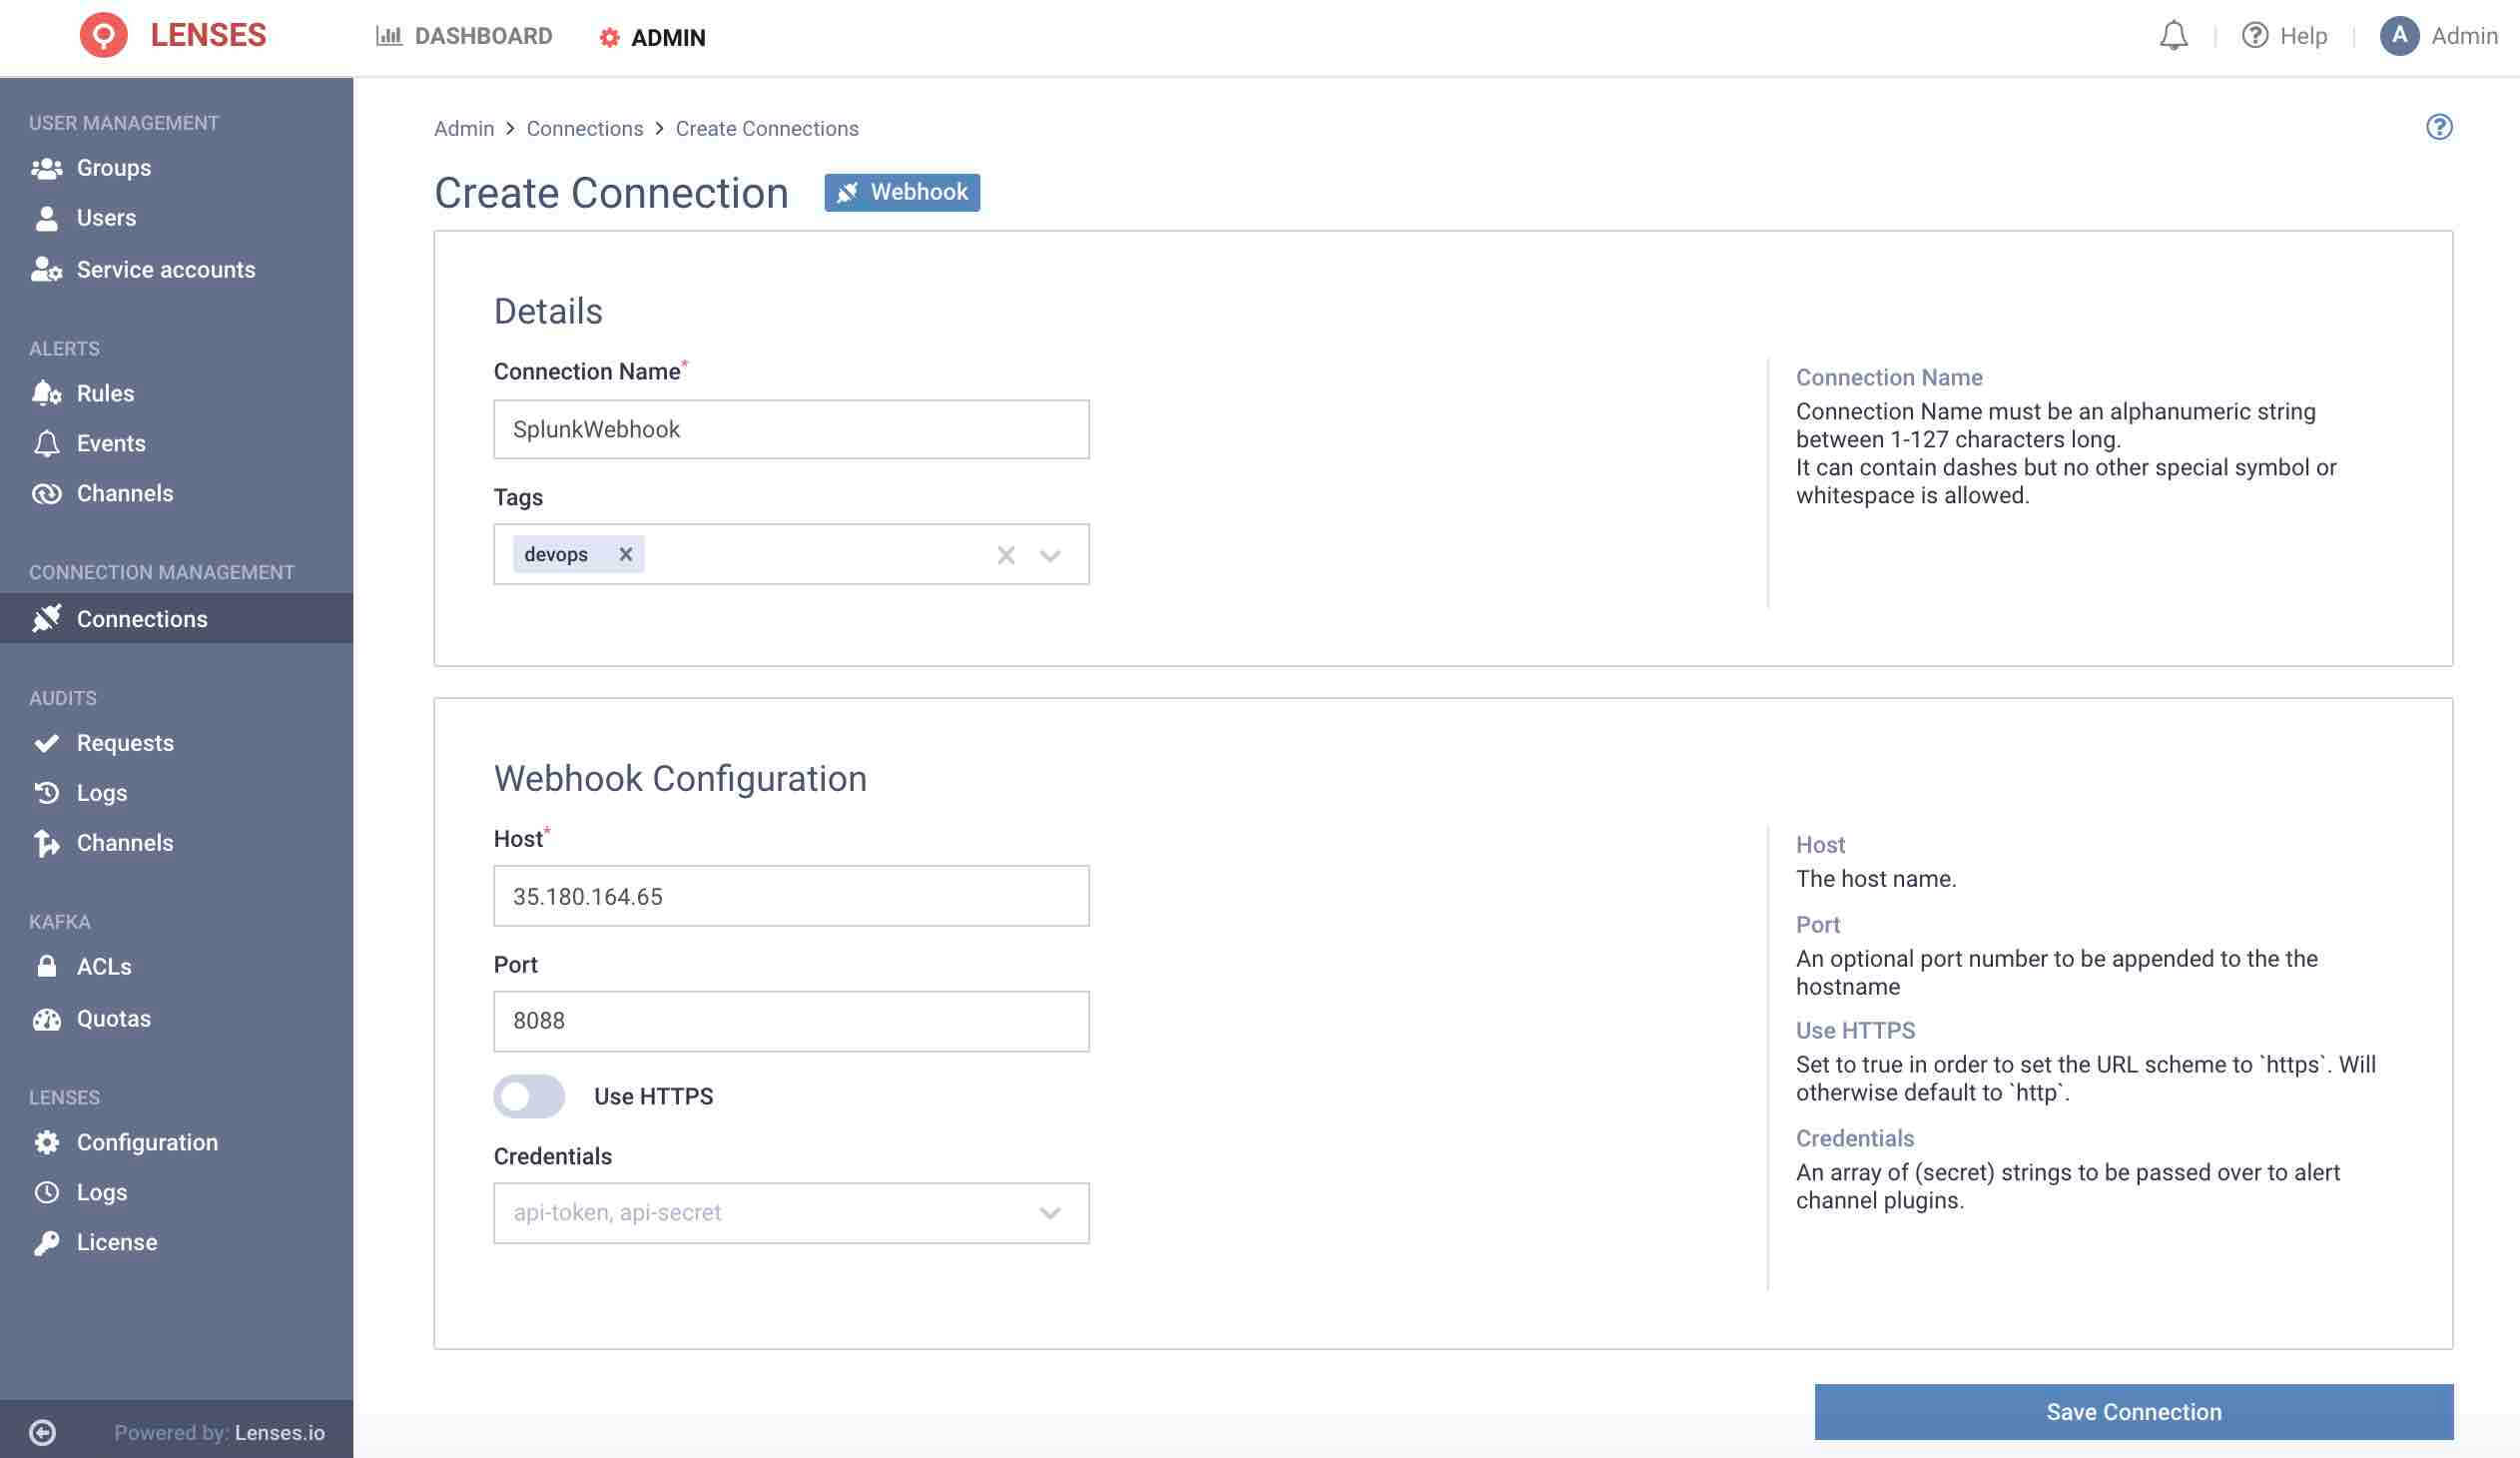
Provide a name for the Connection, such as `SplunkWebhook`
Enter the DNS or IP of your Splunk instance configured with a configured HTTP Event Collector listener. This should be without a path (ie. not including `/services/collector` for example)
Enter the port of the HTTP Event Collector (Splunk default: `8088`).
Enable SSL if necessary.
Credentials are not required at this stage. The HTTP Event Collector Token will be provided in the next step.
#### Add channel
Next, add one or multiple target Splunk webhook channels.
**1.** Visit **Admin → Channels** and click **Webhook**
**2.** Setup the configuration options
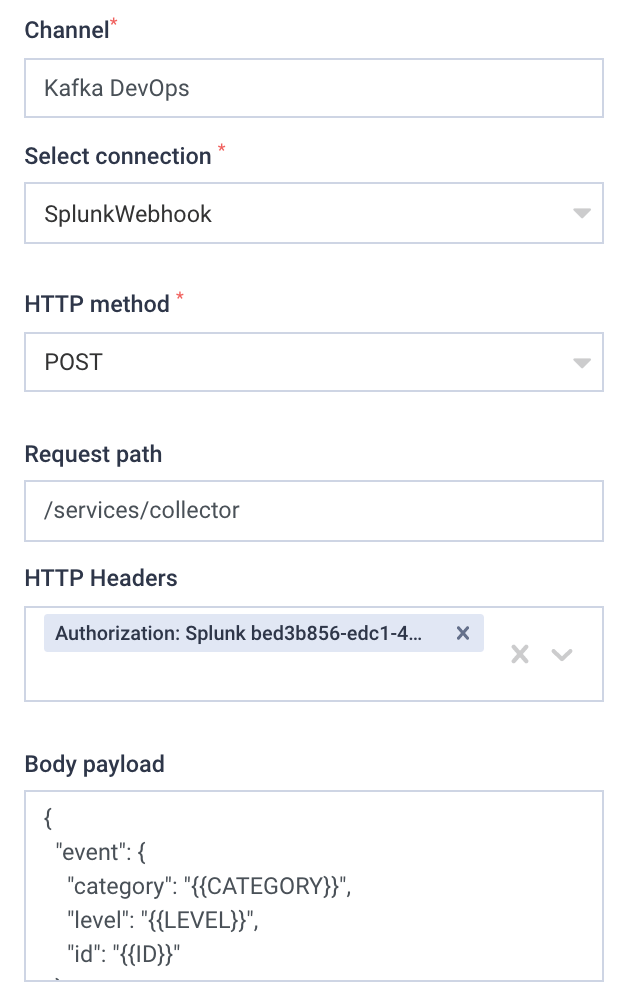
For example, the above will create the `Kafka DevOps` channel using the **Webhook** connection.
The Splunk Connection created in the previous step is selected as the Connection.
Enter a header declaring the Splunk HEC Token. The format must be:
`Authorization: Splunk <>`
For the Request path, enter the exact value:
`/services/collector`
The body payload must include a valid JSON object for Splunk to accept.
The alert payload must be held in an `event` object within the JSON. Such as:
```json
{
"event": {
"category": "{{CATEGORY}}",
"level": "{{LEVEL}}",
"id": "{{ID}}"
}
}
```
See the webhooks section for full details about available variables.
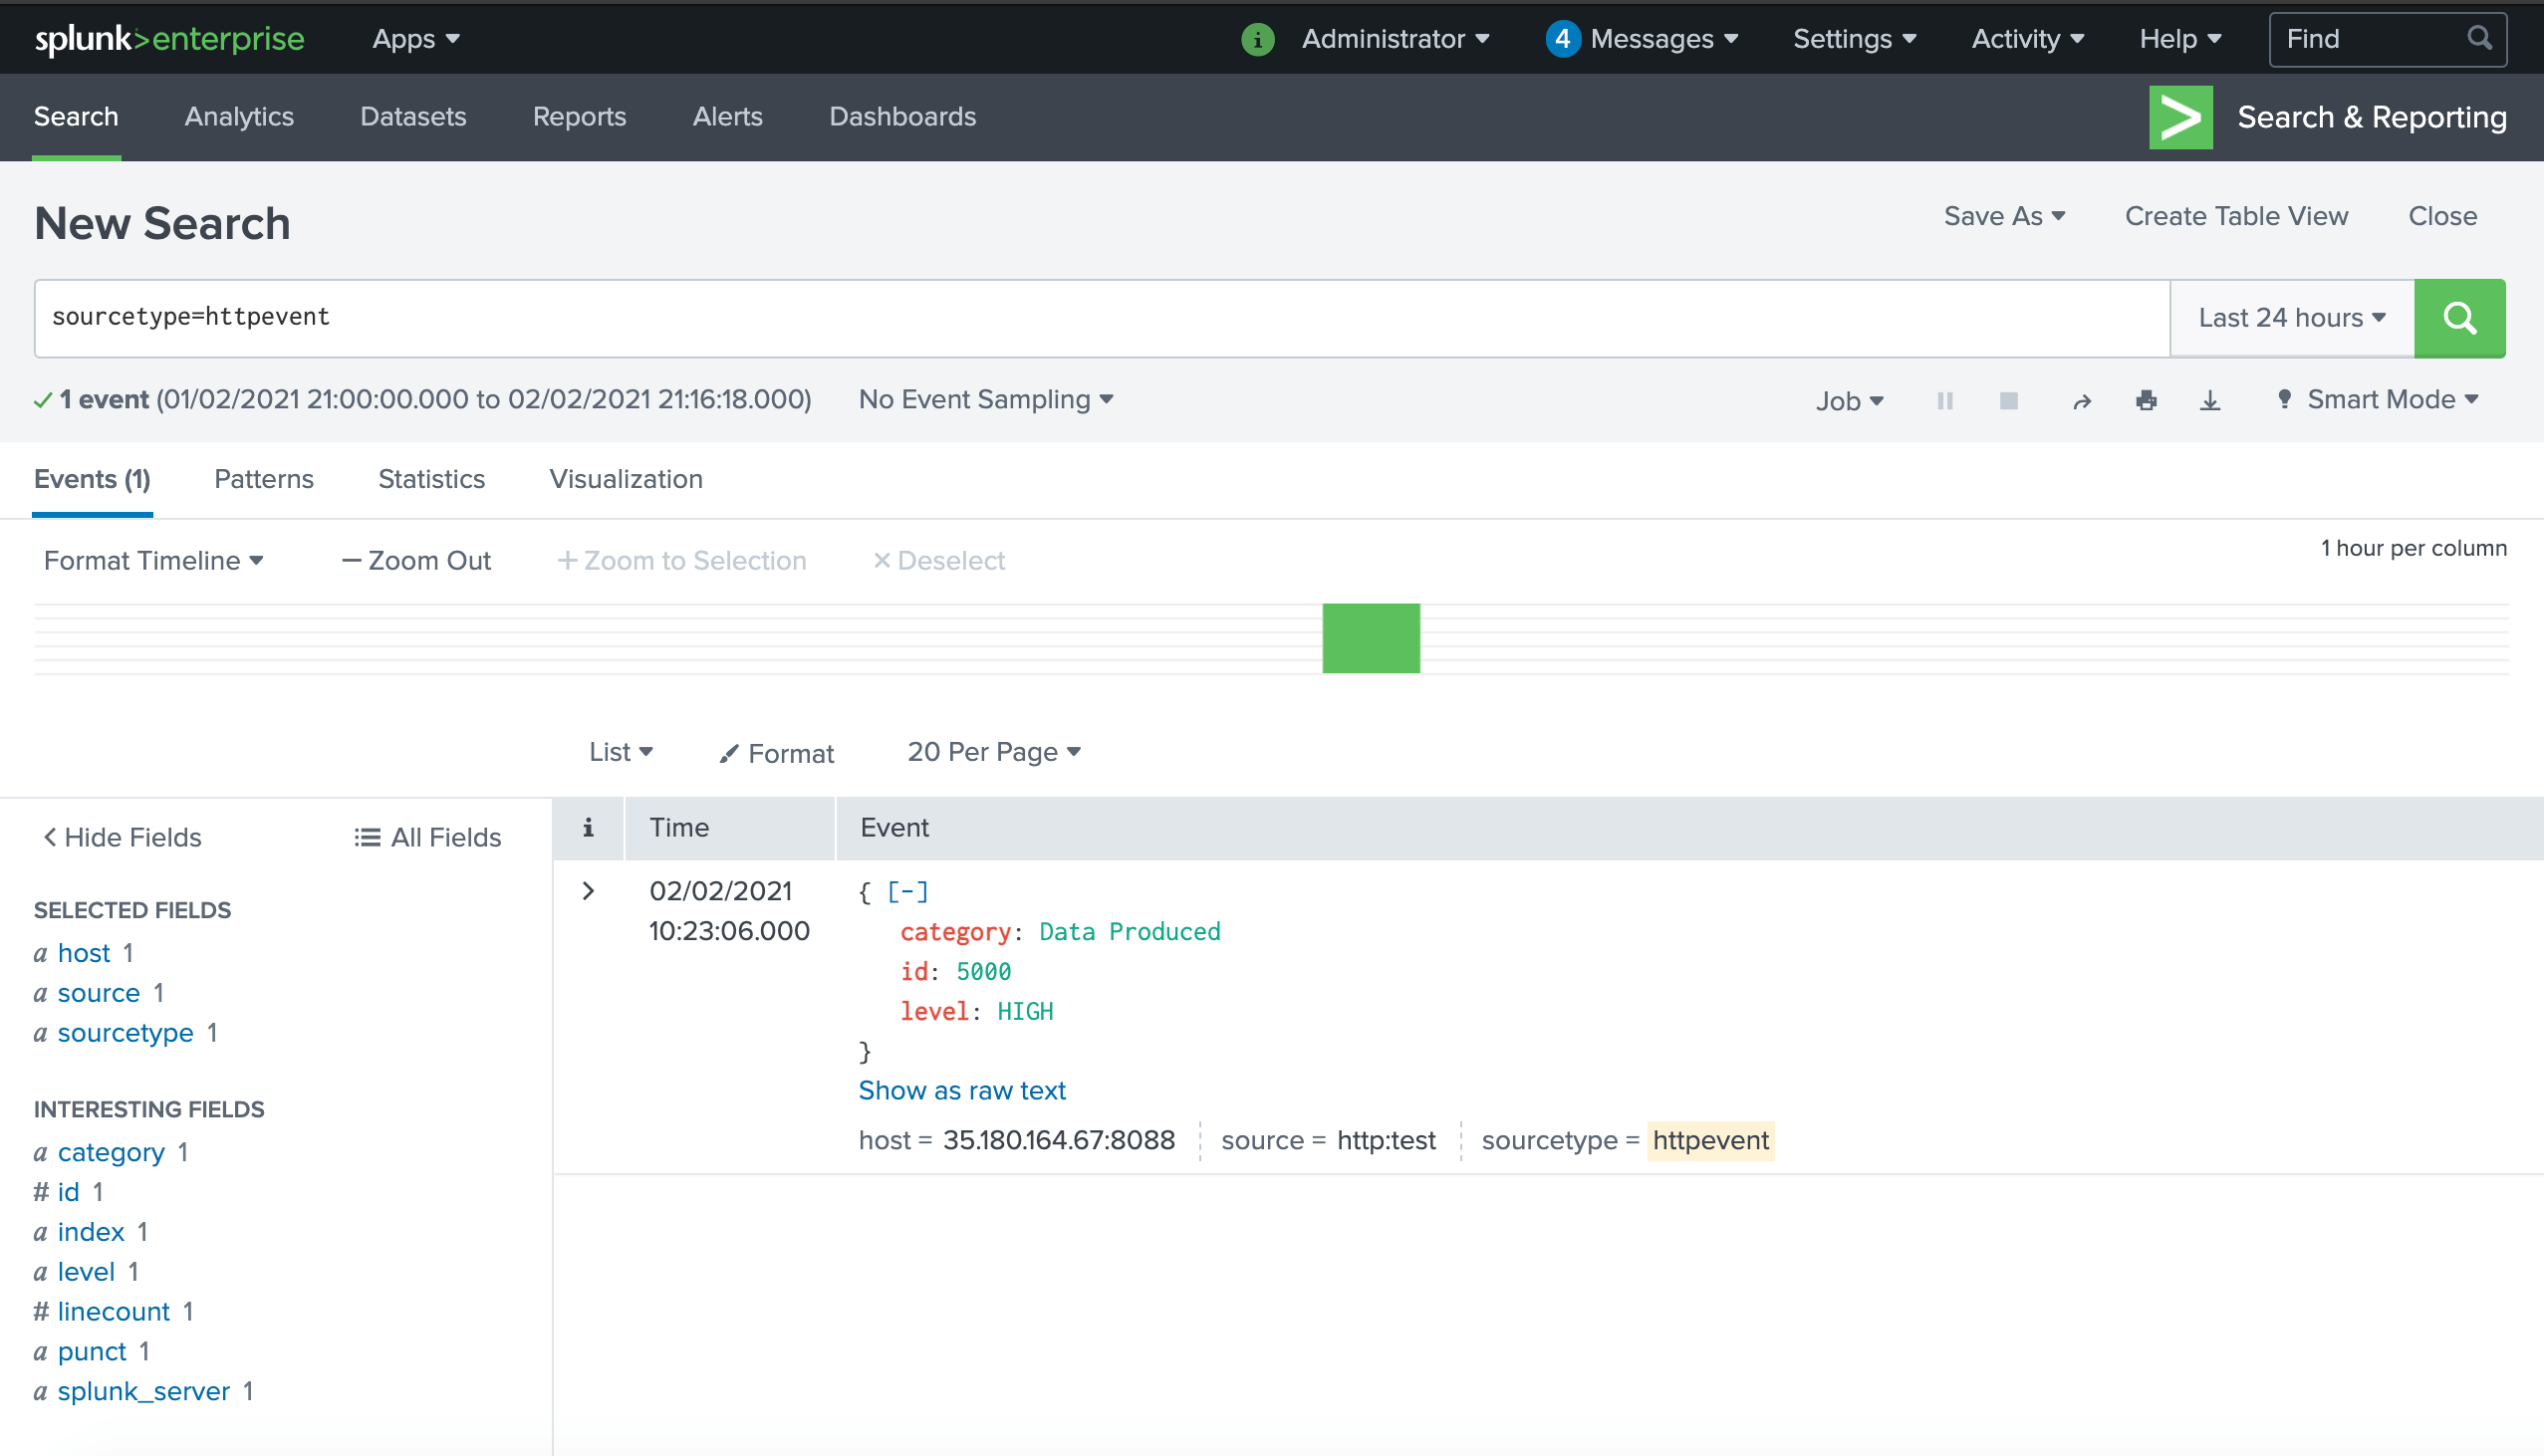
The event will appear like the following in Splunk:
Test sending an alert before saving via a cURL command
```bash
curl -v -k PROTOCOL://YOUR_ SPLUNK_HOST:8088/services/collector -H "Authorization: Splunk YOUR_TOKEN" -d '{ "event": { "category": "{{CATEGORY}}", "level": "{{LEVEL}}", "id": "{{ID}}" } }'
```
#### An example
If, for example, you create a rule to send Apache Kafka Broker monitoring notifications to Splunk the moment a Broker goes offline, and `HTTP POST` will be sent to Splunk via the Splunk HTTP Event Collector. This can then also be analyzed in Splunk ITSI.